Sequencing methodology and control experiments

Overview of library preparation and sequencing:
- Start from 400 µl frozen serum sample.
- Extract total RNA with double elution for maximal template recovery.
- cDNA synthesis and 30 cycles of PCR using life technologies SuperScript® III One-Step RT-PCR System with Platinum® Taq High Fidelity DNA Polymerase. PCR is done separately for six overlapping fragments labeled F1 through F6.
- Library preparation using Illumina Nextera XT® sample preparation kit, followed by column purification. Size selection with the Sage Science BluePippin® with cutoffs at 550 and 900 bp. These sizes include the library adaptors.
- Sequencing on illumina MiSeq® using 500 or 600 cycles kit.
- Mapping and cleaning of the sequencing reads (in house Python application).

Sequencing quality:
The graphs show the fraction of bases sequenced with a quality better than the indicated threshold for each position in read 1 and read 2 (this run used a 3x250 cycle kit). Phred qualities are estimate by CASAVA 1.8 during base calling. Things to note:
- a slow linear decrease even for the threshold Q10. This is due to short inserts escaping size selection
- quality deteriorates towards the end of read 2, likely due to phasing errors and optical overlap of bridge-amplified clusters on the flow cell.
- We typically used a Phred quality threshold of 30 for our analysis, corresponding to a miscalling rate of 0.1%.

Phred scores and actual error rates:
- PhiX control (provided by Illumina) was spiked in all sequencing run to monitor sequencing errors.
- Reported Phred quality correlates well with the actual error rate down to 0.1% (Q30)
- In HIV amplicons, other sources of errors, such as PCR, dominate over sequencing errors (after filtering for >Q30)

Sequencing errors:
A reference HIV-1 strain expressed from a plasmid (NL4-3) was amplified and sequenced to measure sequencing errors and, to some extent, PCR errors. The error level was around 0.1-0.2%.

Variant frequencies in fragment overlaps
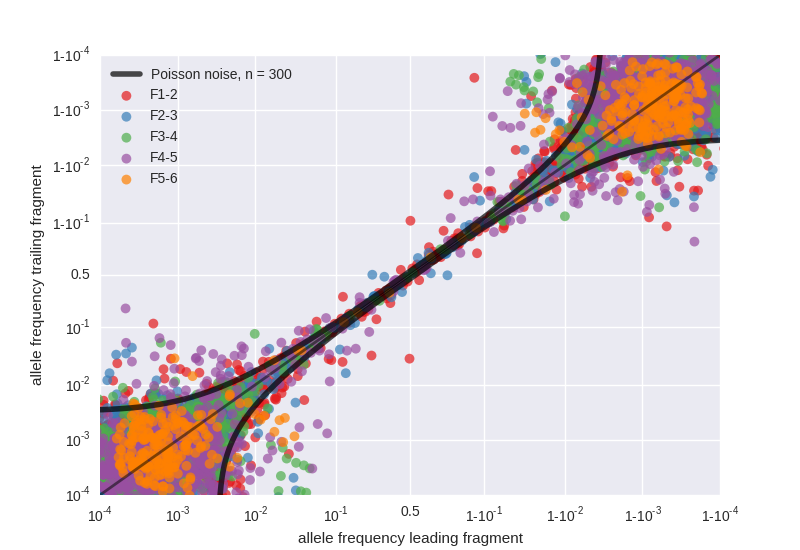
- The six fragments F1 to F6 overlap between 200 and 350 bases
- Variants in these overlaps are sequenced in replicate in a completely independent fashion (starting at reverse transcription)
- The figure shows the correlation between variant frequencies in the leading and trailing fragments, deviations from the diagonal signal PCR bias or low template input
- Variant frequencies in overlaps are used to quantify the accuracy of frequency estimation for each sample
- For each sample and fragment, we quantify the variant frequency accuracy by an effective template number. Effective template numbers are several hundreds for most samples and fragments, but tend to be low for F5.

Linkage and insert sizes:
- To obtain linkage information, the we strove to obtain long paired reads that make optimal use of the 2x250 cycles kits used for sequencing.
- The original Illumina NexteraXT® protocol yields reads much shorter than the desired insert size.
- Additional stringent size selection with the Sage Science BluePippin® resulted in inserts ~500bp